Research infrastructure for listed companies.

VISION3 reads primary disclosure, builds driver-based models and produces cited research notes. Chat, models, reports, tasks and monitoring in one system.

Arrive prepped to your management meetings.

VISION3 tracks the meetings on your calendar, prepares against the latest filings, transcripts and your own models, and attaches the prep you need, questions, tear sheet, note and deep dive, to each meeting before you walk in.
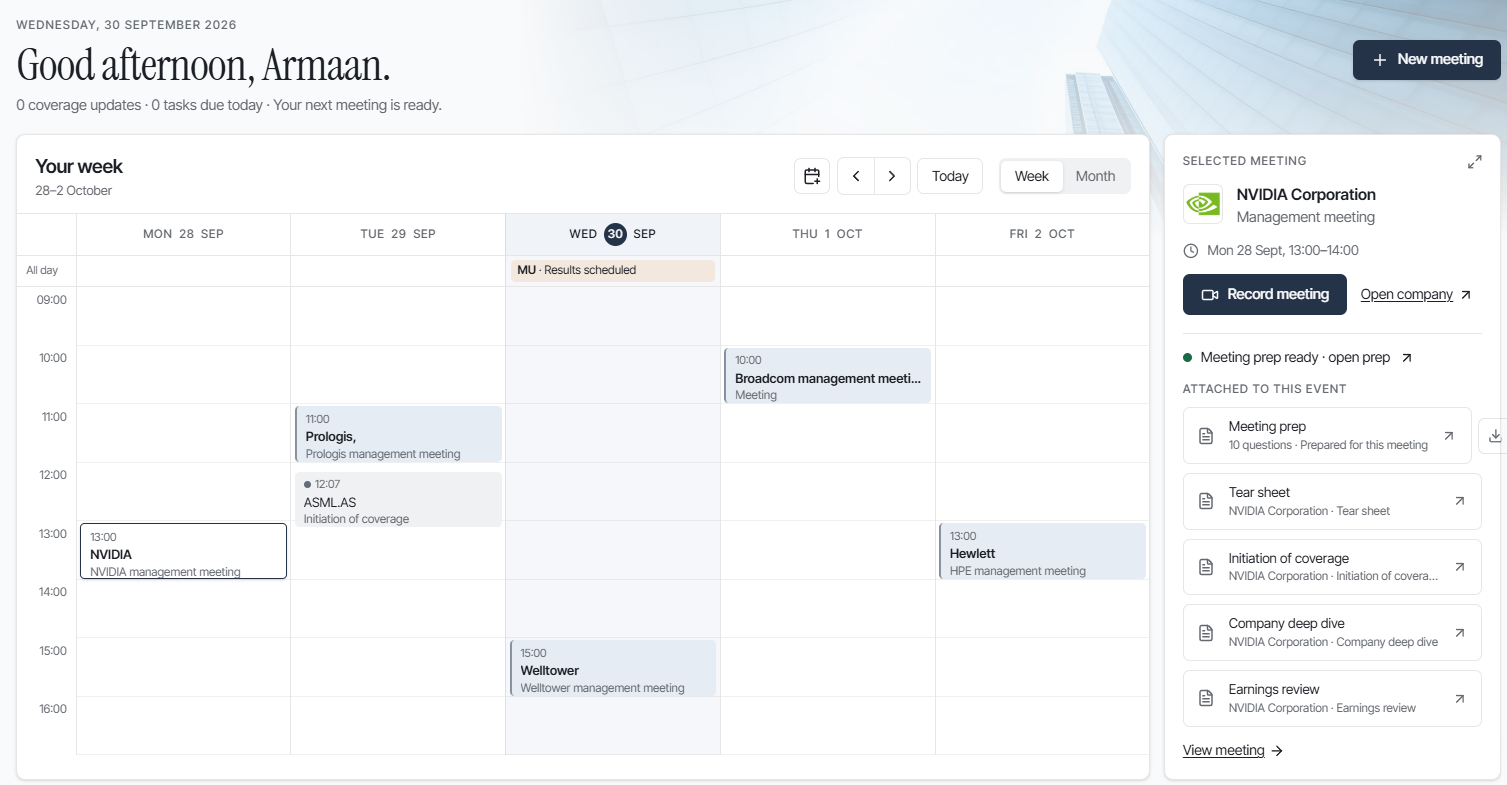
VISION3 meeting prep: week calendar with a NVIDIA management meeting selected and its attached documents

A management meeting in VISION3. The week view shows each company's events; the selected meeting carries its prepared questions, tear sheet, initiation of coverage, deep dive and earnings review.

Equities

Built for financial work that has to be right.

VISION3 research answer with source evidence, page 1 of 6

1 / 6

Global Coverage

VISION3 works across markets and languages. Companies listed in Taipei, Singapore, Tokyo and beyond are read from their own filings, in the language they were published in, with the cited page shown next to the answer.
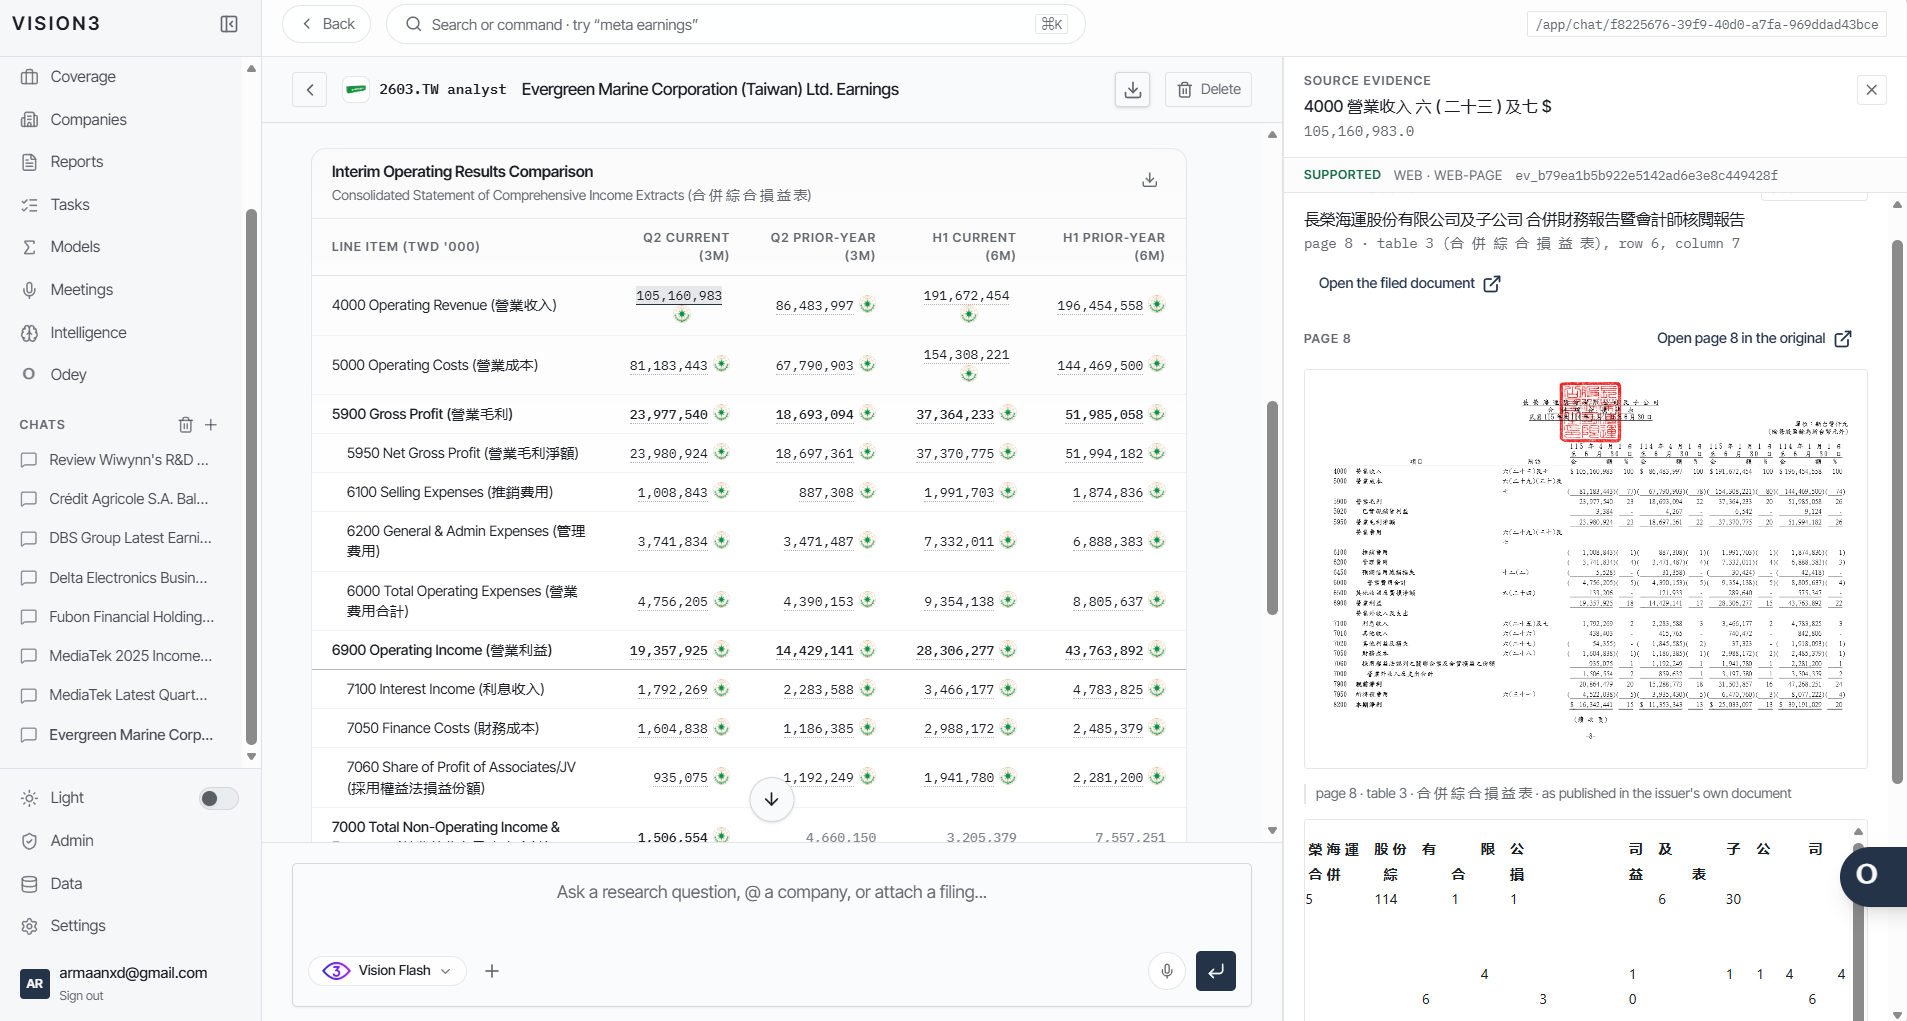
Evergreen Marine (Taiwan) interim operating results read from the issuer's Chinese-language reviewed report, with the cited page in the source evidence panel, page 1 of 4

1 / 4

Macro.

Ask why an index, yield, currency or commodity moved and VISION3 answers with the price chart, dated catalysts, holdings-weighted attribution and cross-asset context, every figure traced to its source.
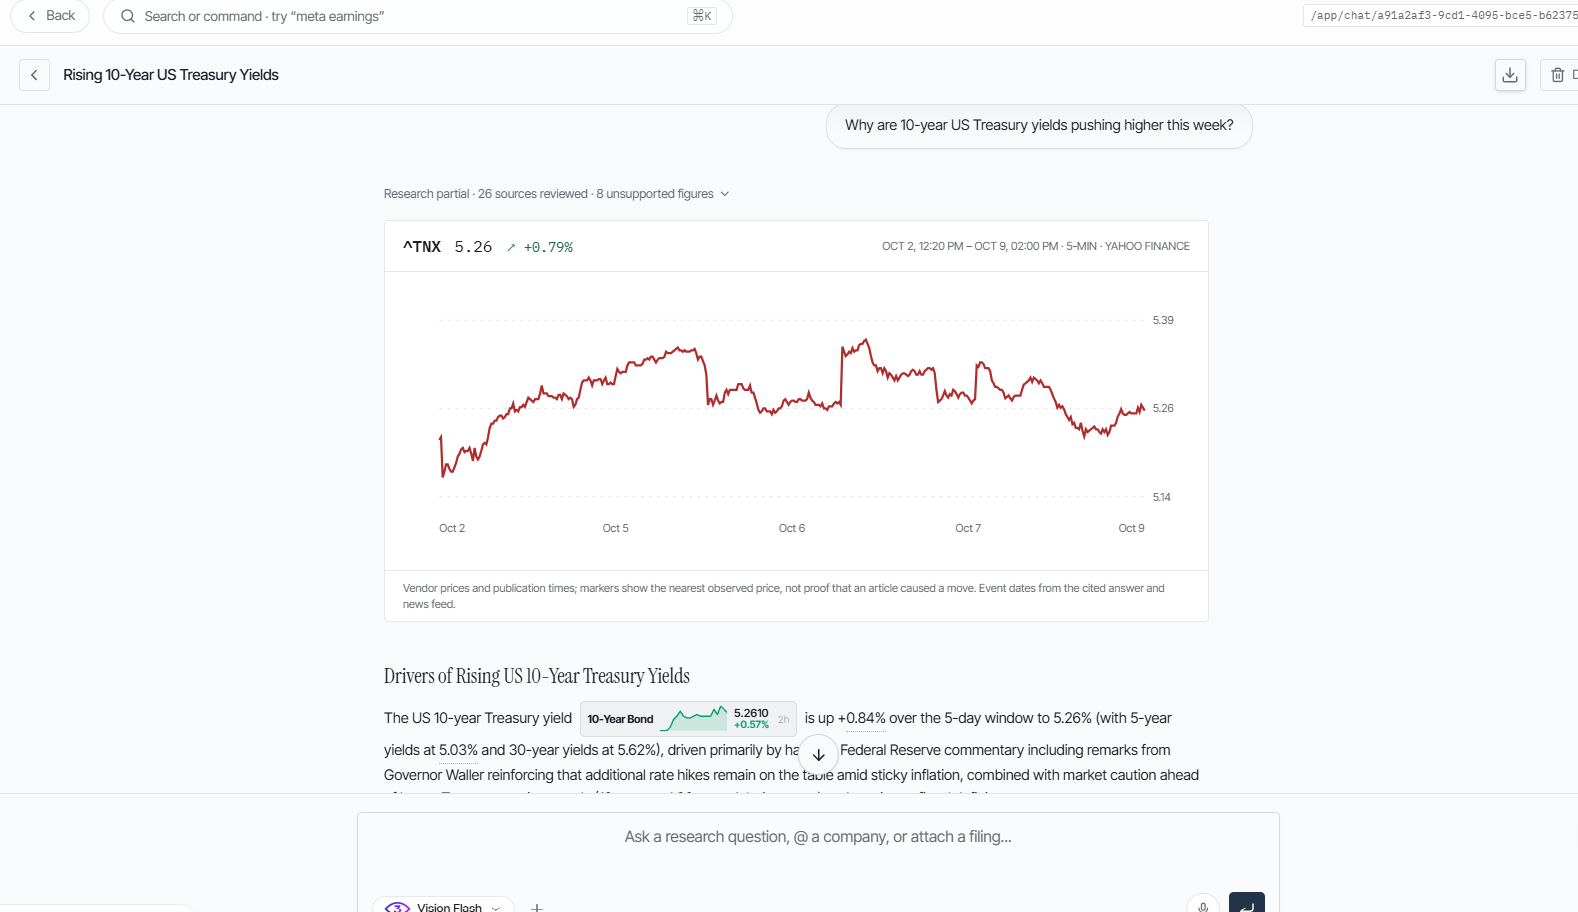
Research chat answering a 10-year US Treasury yield question with an annotated price chart, page 1 of 6

1 / 6

Financial models with full source provenance.

Every model opens as a live workbook. Historical figures are carried straight from the issuer's own statements with their source locators attached; every forecast line is a transparent formula you can trace, edit and export to Excel.

A
B
C
D
E
F
G
H
I
J
K
ASML Holding N.V. (ASML.AS) · Base case · EUR millions unless stated
Historical FY2021A–FY2025A uses admitted issuer statements. Forecast FY2026E–FY2030E references Assumptions (Base column).
Income statement
Line item
FY2021A
FY2022A
FY2023A
FY2024A
FY2025A
FY2026E
FY2027E
FY2028E
FY2029E
FY2030E
6
Net system sales
13,652.8
15,430.3
21,938.6
21,768.7
24,474.3
34,179.0
45,083.8
55,450.3
63,461.8
66,783.0
7
Net service and field option sales
4,958.2
5,743.1
5,619.9
6,494.2
8,193.0
9,340.0
10,647.6
12,138.3
13,837.7
15,774.9
8
Total net sales
18,611.0
21,173.4
27,558.5
28,262.9
32,667.3
43,519.0
55,731.4
67,588.6
77,299.5
82,557.9
9
Revenue growth
13.8%
30.2%
2.6%
15.6%
33.2%
28.1%
21.3%
14.4%
6.8%
10
Cost of system sales
(6,482.9)
(7,582.3)
(10,151.0)
(10,406.9)
(11,384.0)
(14,228.1)
(18,046.4)
(21,158.0)
(17,518.1)
(14,537.1)
11
Cost of service and field option sales
(2,319.1)
(2,891.0)
(3,271.4)
(3,364.0)
(4,025.3)
(4,585.9)
(5,228.0)
(5,959.9)
(6,794.3)
(7,745.5)
12
Total cost of sales
(8,802.0)
(10,473.3)
(13,422.4)
(13,770.9)
(15,409.3)
(18,814.1)
(23,274.4)
(27,117.9)
(24,312.4)
(22,282.6)
13
Gross profit
9,809.0
10,700.1
14,136.1
14,492.0
17,258.0
24,704.9
32,457.1
40,470.8
52,987.1
60,275.3
14
Gross margin
52.7%
50.5%
51.3%
51.3%
52.8%
56.8%
58.2%
59.9%
68.5%
73.0%
15
Research and development (R&D) costs
(2,547.0)
(3,253.5)
(3,980.6)
(4,303.7)
(4,698.8)
(5,439.9)
(6,966.4)
(8,448.6)
(9,662.4)
(10,319.7)
16
R&D as % of sales
13.7%
15.4%
14.4%
15.2%
14.4%
12.5%
12.5%
12.5%
12.5%
12.5%
17
Selling, general and administrative (SG&A) costs
(725.6)
(945.9)
(1,113.2)
(1,165.7)
(1,257.8)
(1,610.2)
(2,062.1)
(2,500.8)
(2,860.1)
(3,054.6)
18
SG&A as % of sales
3.9%
4.5%
4.0%
4.1%
3.9%
3.7%
3.7%
3.7%
3.7%
3.7%
19
Other income
213.7
-
-
-
-
-
-
-
-
-
20
Income from operations
6,750.1
6,500.7
9,042.3
9,022.6
11,301.4
17,654.8
23,428.6
29,521.4
40,464.6
46,901.0
21
Operating margin
36.3%
30.7%
32.8%
31.9%
34.6%
40.6%
42.0%
43.7%
52.3%
56.8%
22
Depreciation and amortization
471.0
583.6
739.8
918.6
1,025.9
1,364.9
1,788.9
2,276.3
2,787.7
3,262.6
23
EBITDA
7,221.1
7,084.3
9,782.1
9,941.2
12,327.3
19,019.8
25,217.5
31,797.7
43,252.3
50,163.5
24
EBITDA margin
38.8%
33.5%
35.5%
35.2%
37.7%
43.7%
45.2%
47.0%
56.0%
60.8%
25
Interest and other, net
(44.6)
(44.6)
41.2
19.8
104.7
108.8
139.3
169.0
193.2
206.4
26
Income before income taxes
6,705.5
6,456.1
9,083.5
9,042.4
11,406.1
17,763.6
23,567.9
29,690.4
40,657.8
47,107.3
27
Income tax expense
(1,021.4)
(969.9)
(1,435.8)
(1,680.6)
(2,013.4)
(3,318.6)
(4,357.7)
(5,445.0)
(7,293.6)
(8,376.7)
28
Effective tax rate
15.2%
15.0%
15.8%
18.6%
17.7%
18.7%
18.5%
18.3%
17.9%
17.8%
29
Income after income taxes
5,684.1
5,486.2
7,647.7
7,361.8
9,392.7
14,445.1
19,210.2
24,245.4
33,364.3
38,730.6
30
Profit from equity method investments
199.1
138.0
191.3
209.8
216.7
282.9
362.3
439.3
502.4
536.6
31
Net income
5,893.2
5,624.2
7,839.0
7,571.6
9,609.4
14,728.0
19,572.5
24,684.7
33,866.7
39,267.2

A VISION3 Base+ model for ASML Holding N.V. Historical FY2021A–FY2025A lines are sourced to the issuer's admitted statements; the forecast block recalculates from the Base assumptions column.

End to end equity analyst workflow.
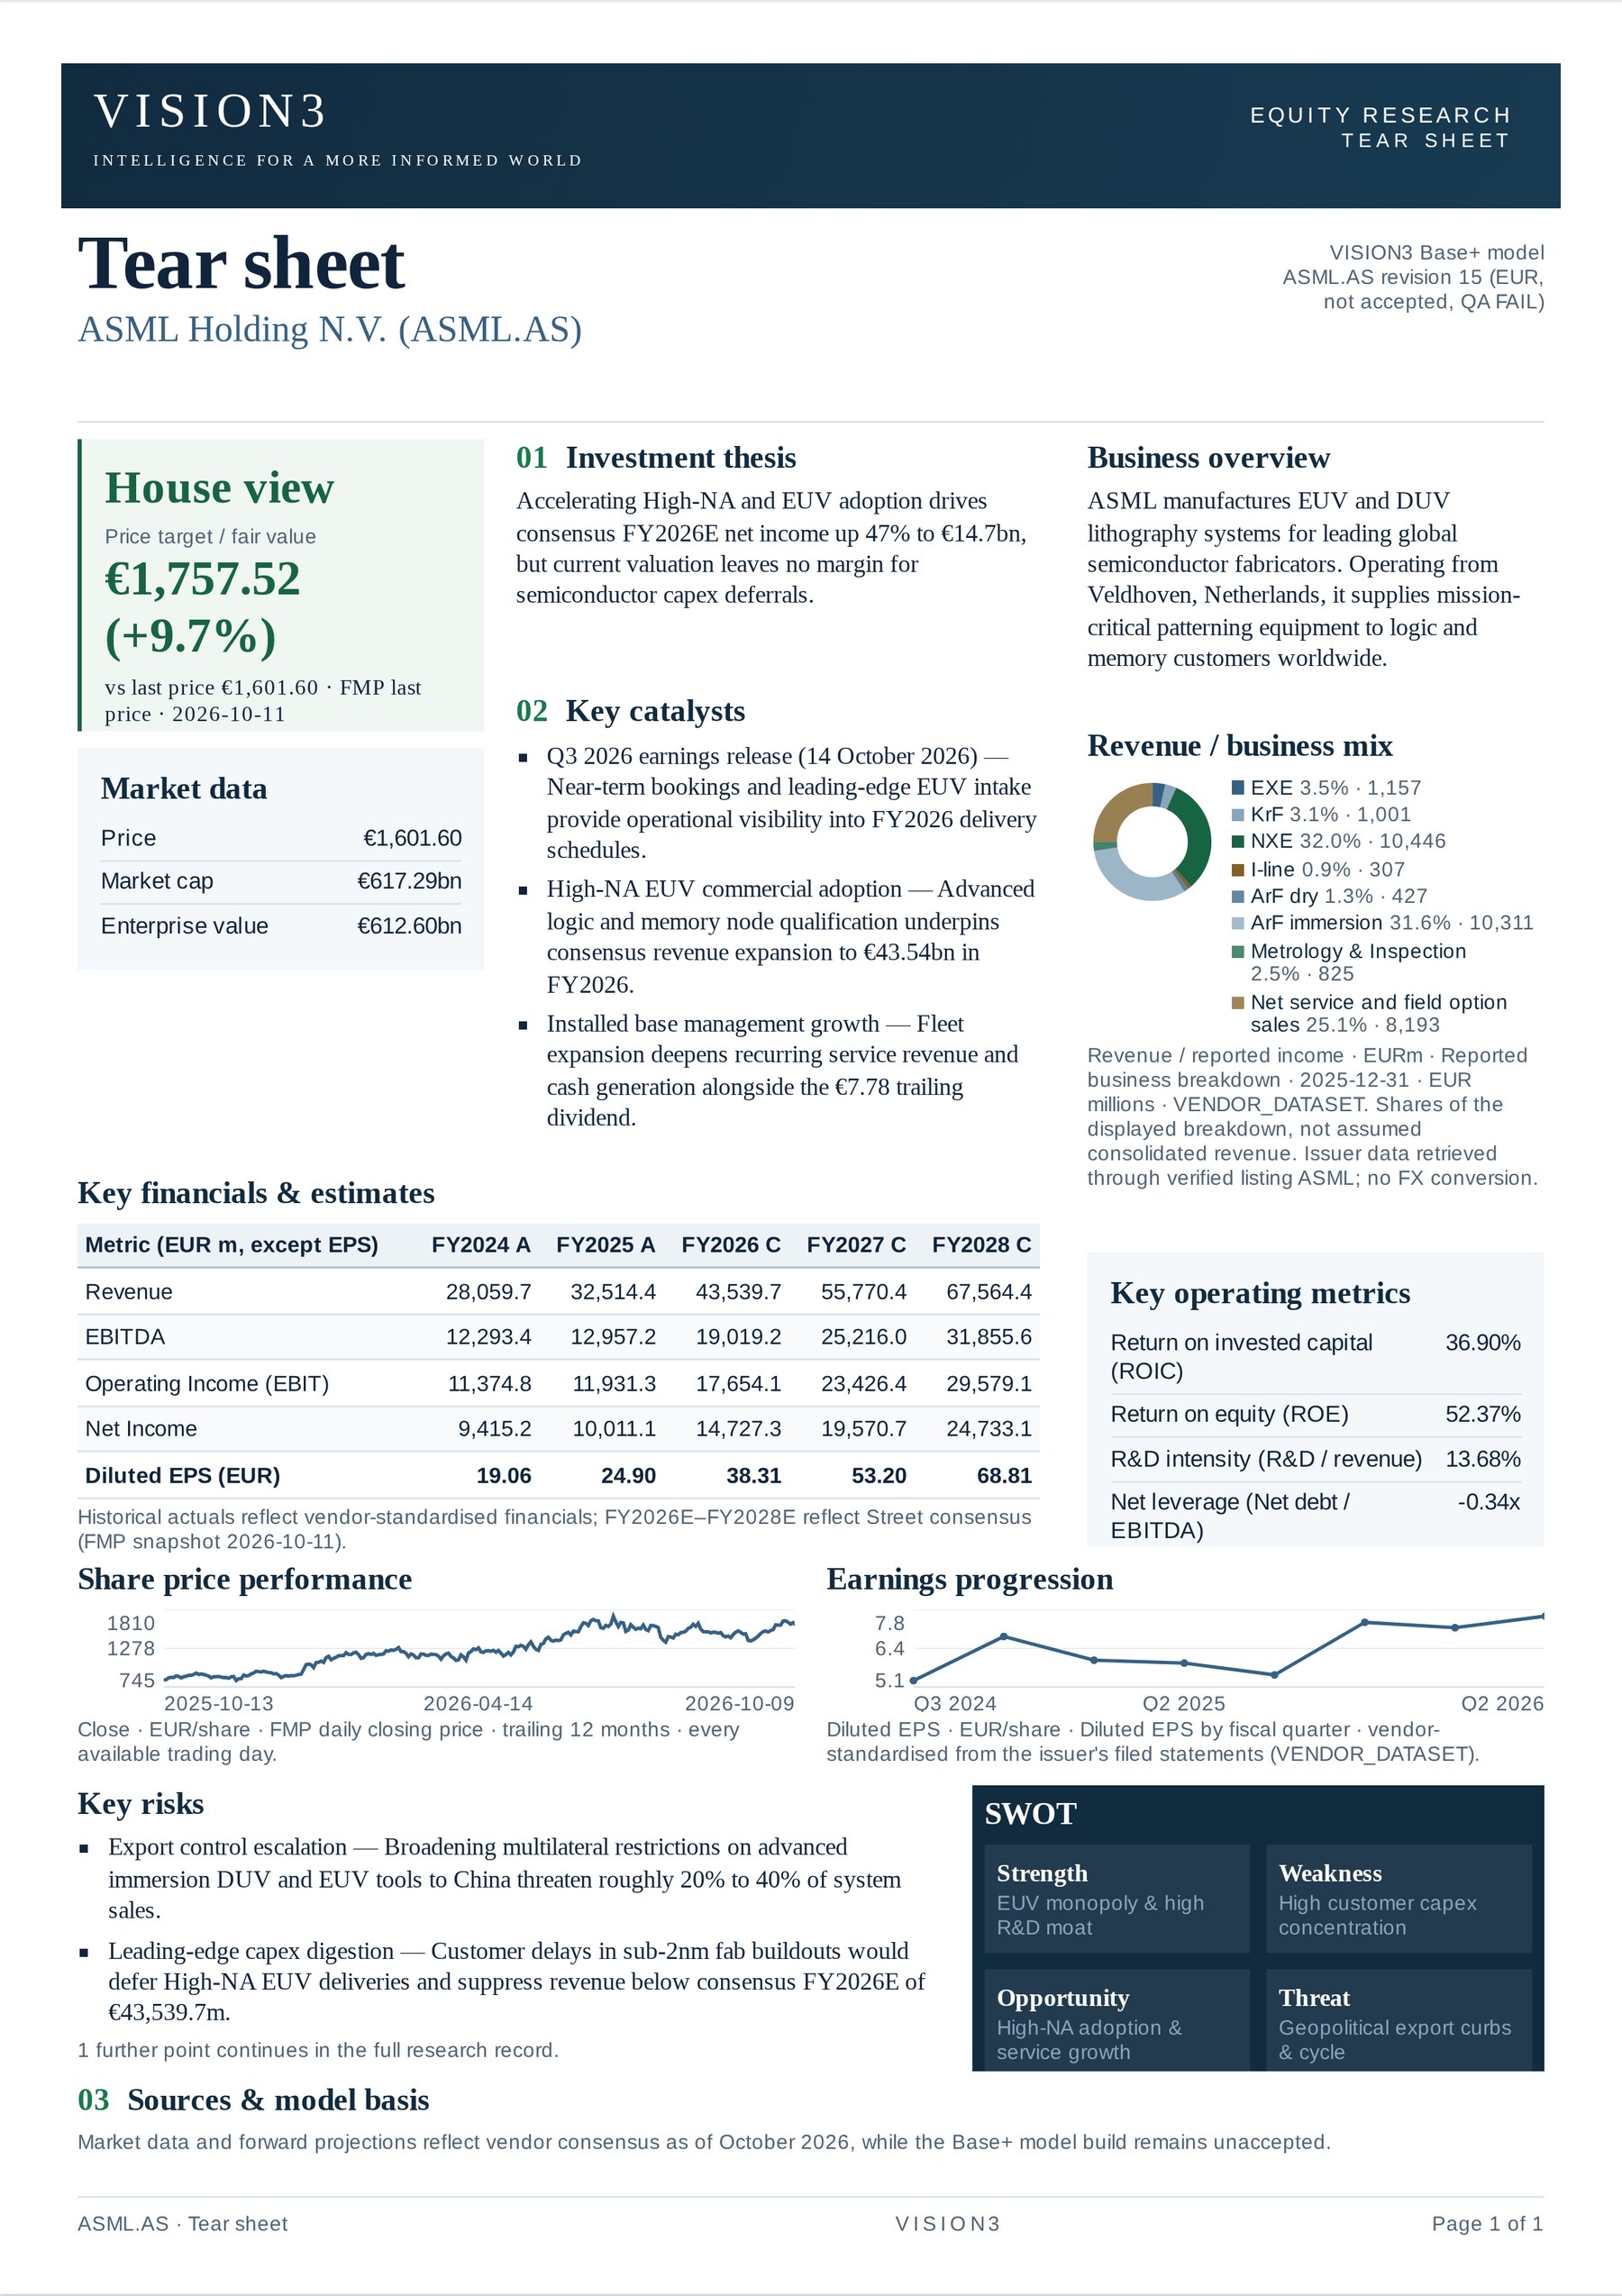
VISION3 tear sheet on ASML Holding N.V.: house view and market data, investment thesis, key catalysts, business overview and revenue mix, key financials and estimates, operating metrics, share price and quarterly earnings charts, key risks and SWOT

A VISION3 tear sheet on ASML Holding N.V., produced end to end by the platform from the issuer's own filings, market data and admitted estimates. open the full tear sheet.

What is inside.

Research chat

Ask a company question and get an answer traced to the source document, page and line.

Company workspace

Filings, transcripts, estimates, operating data and events in one place.

Financial models

Driver-based operating models with live recalculation and a full audit trail.

Research reports

Initiation of coverage, tear sheets, earnings reviews, thesis updates and deep dives.

Research tasks

Standing monitors for earnings, filings, guidance, estimates, news and price moves.

Valuation

NAV, DCF, scenarios and sensitivities built on sector-specific frameworks.

Source library

Every filing, transcript and document stored with provenance and exact locators.

Screening

Discount to NAV, implied cap rate, same-store NOI, leverage and development metrics.

See the depth behind the idea.